This project uses SQL (SQL Server) to analyze an e-commerce transactions dataset from Kaggle, exploring real-world analytical questions around sales growth, category performance, age-based spending, and repeat customer behavior.


In this project we use Python to access the API of CoinMarketCap and their prices of Crypto, then create a function for it to run automatically and append the data to an existing document.
Which will give us information on the change of Crypto prices over a set time.

In this project we use SQL Server Management System to create a database, Query the data, use CTE and CASE to group the data, before we import it into Power BI where we create DAX measures and visualisations on Cyber Threats in Germany.
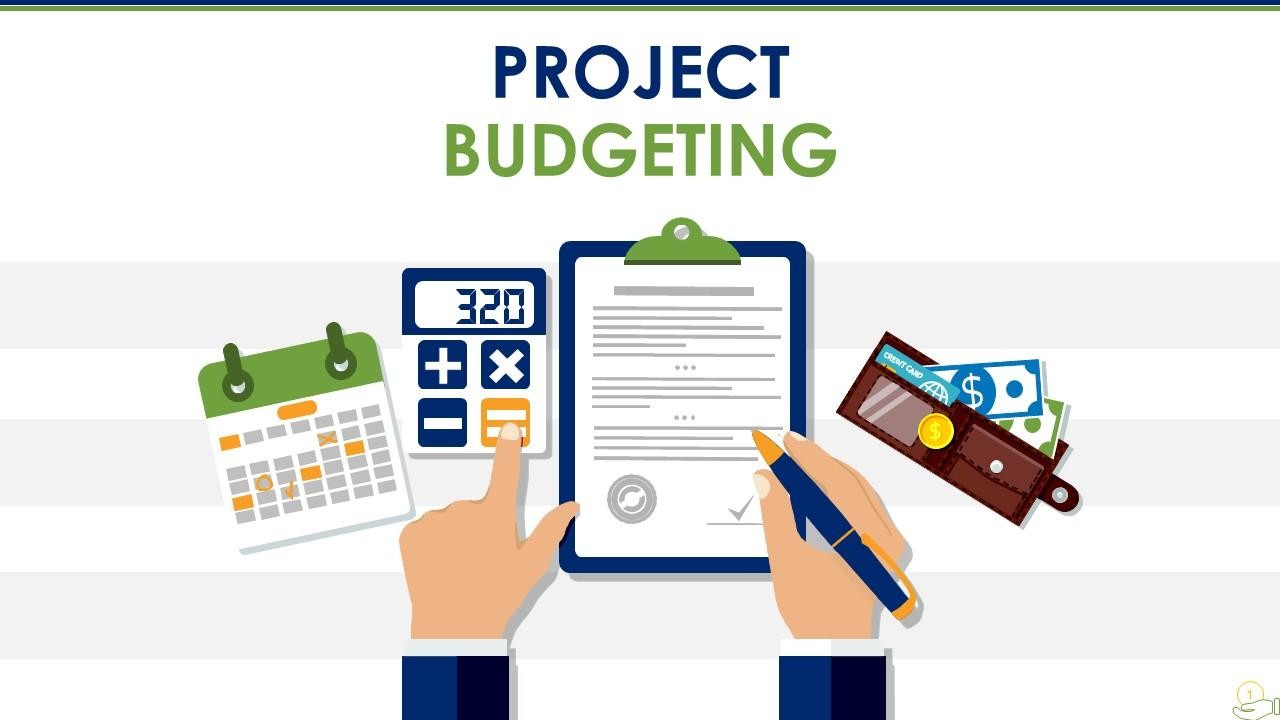
In this project we use SQL Server Management System to create a database, Query the data, make a CTE and join the data together for the optimal information to visualize, before we import it to Power BI and create an interactive Dashboard on a Company's project budgets.

In this project we use SQL Server Management System to create a database, Query and join the data for the exact information we need, then import it into Power BI through SQL Server where we create an Interactive dashboard on Absenteeism in the workplace.

In this project we will create a dashboard in Power BI, hosting a SQL server and database where we will pull data into Power BI from, and answer the question of where and when the company gets their money from.

In this project we use SQL Server Management System to create a database, join multiple tables from an Excel file together, before connecting Power BI to the SQL Server and creating a dashboard on hotel revenue.

In this project we use Python and Web Scraping to access information from a product on Amazon, then create a function for it to run in the background in order to keep up to tabs with the varying price of the item.

In this project we clean and explore data in a SQL server in order to get a better grasp of the landscape around the layoffs that
has been happening these past couple of years.

In this project we used Tableau to create a dashboard to give us a glimpse into the offensive capabilities of the various volleyball positions.
In this project we use Python to scrape information on the largest companies in the US from a Wikipedia site, then neatly put them into a table and save them to a csv file.

In this project we used Excel to clean data about Bike Sales before creating a dashboard featuring key information on income, distance to work, and age brackets and their impact on buying a bike.